Help
There are some general FAQs listed below explaining how the tool works, and datasets used for the cell-specific gene enrichment. In case of any other questions please contact
geetu@iastate.edu
.
- What are the different cell-specific gene groups used for cell-specific gene enrichment?
- How to cite PlacentaCellEnrich in your research?
- What are the different datasets used for cell-specific gene enrichment in PlacentaCellEnrich?
- Can we use background genes for carrying out cell-specific gene enrichment?
- Why are a lot of genes in the input data not found?
- Why is No.of.Cells always "N.A." for Suryawanshi et al. data?
- What is in the downloaded files?
- How should I interpret my results?
- How come the enrichment plot does not show any results?
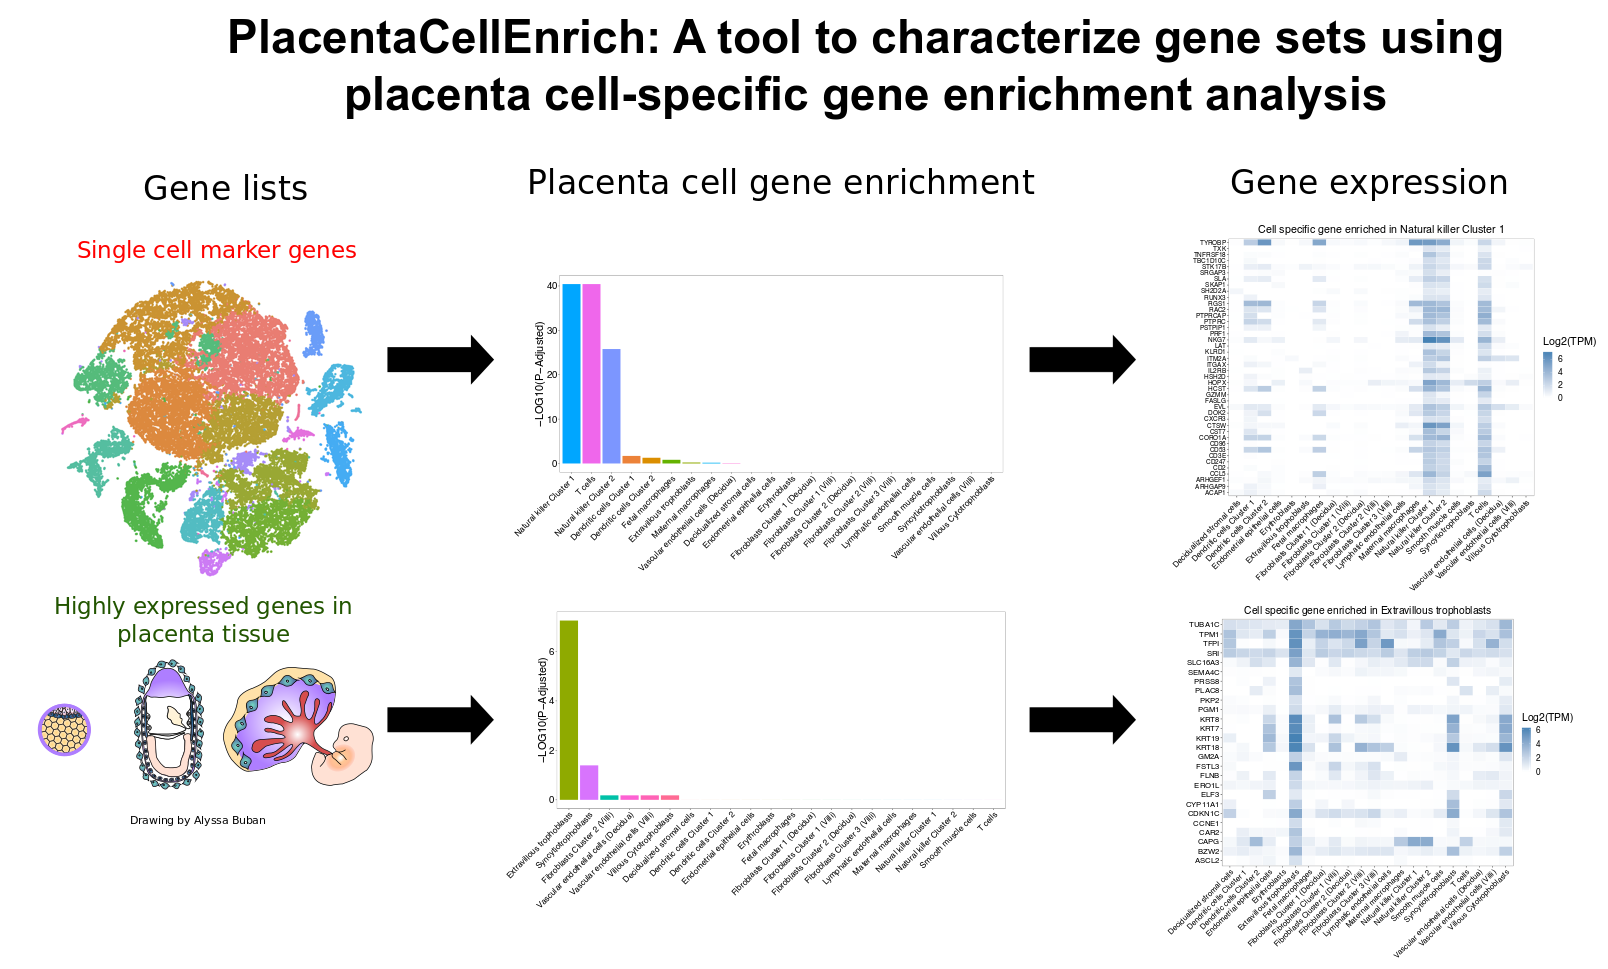
Defining Cell-Specific Genes
Cell-specific genes are defined using the algorithm from the HPA (Uhl�n et al. 2015), and can be grouped as follows:
-
Not Expressed:
Genes with an expression level less than an expression threshold specified by user across all the cells.
-
Cell Enriched:
Genes with an expression level greater than or equal to the expression threshold that also have at least five-fold higher expression levels in a particular cell compared to all other cells.
-
Group Enriched:
Genes with an expression level greater than or equal to the expression threshold that also have at least five-fold higher expression levels in a group of 2-7 cells compared to all other cells, and that are not considered Cell Enriched.
-
Cell Enhanced:
Genes with an expression level greater than or equal to the expression threshold that also have at least five-fold higher expression levels in a particular cell compared to the average levels in all other cells, and that are not considered Cell Enriched or Group Enriched.
-
Expressed in all:
Genes with an expression level greater than or equal to the expression threshold across all of the cell that are not in any of the above 4 groups.
-
Mixed:
Genes that are not assigned to any of the above 5 groups.
Genes from the
Cell Enriched
,
Group Enriched
, and
Cell Enhanced
groups are classified as Cell-specific genes.
Citation
Jain A and Tuteja G (2020). PlacentaCellEnrich: A tool to characterize gene sets using placenta cell-specific gene enrichment analysis.
Placenta
,
doi.org/10.1016/j.placenta.2020.10.029
.
Datasets
PlacentaCellEnrich defines cell-specific genes using single-cell RNA-Seq (scRNA-Seq) data from three placental studies. The datasets used in the tool are:
-
Suryawanshi H et al.:
scRNA-Seq data across 22 placental and decidual cells
-
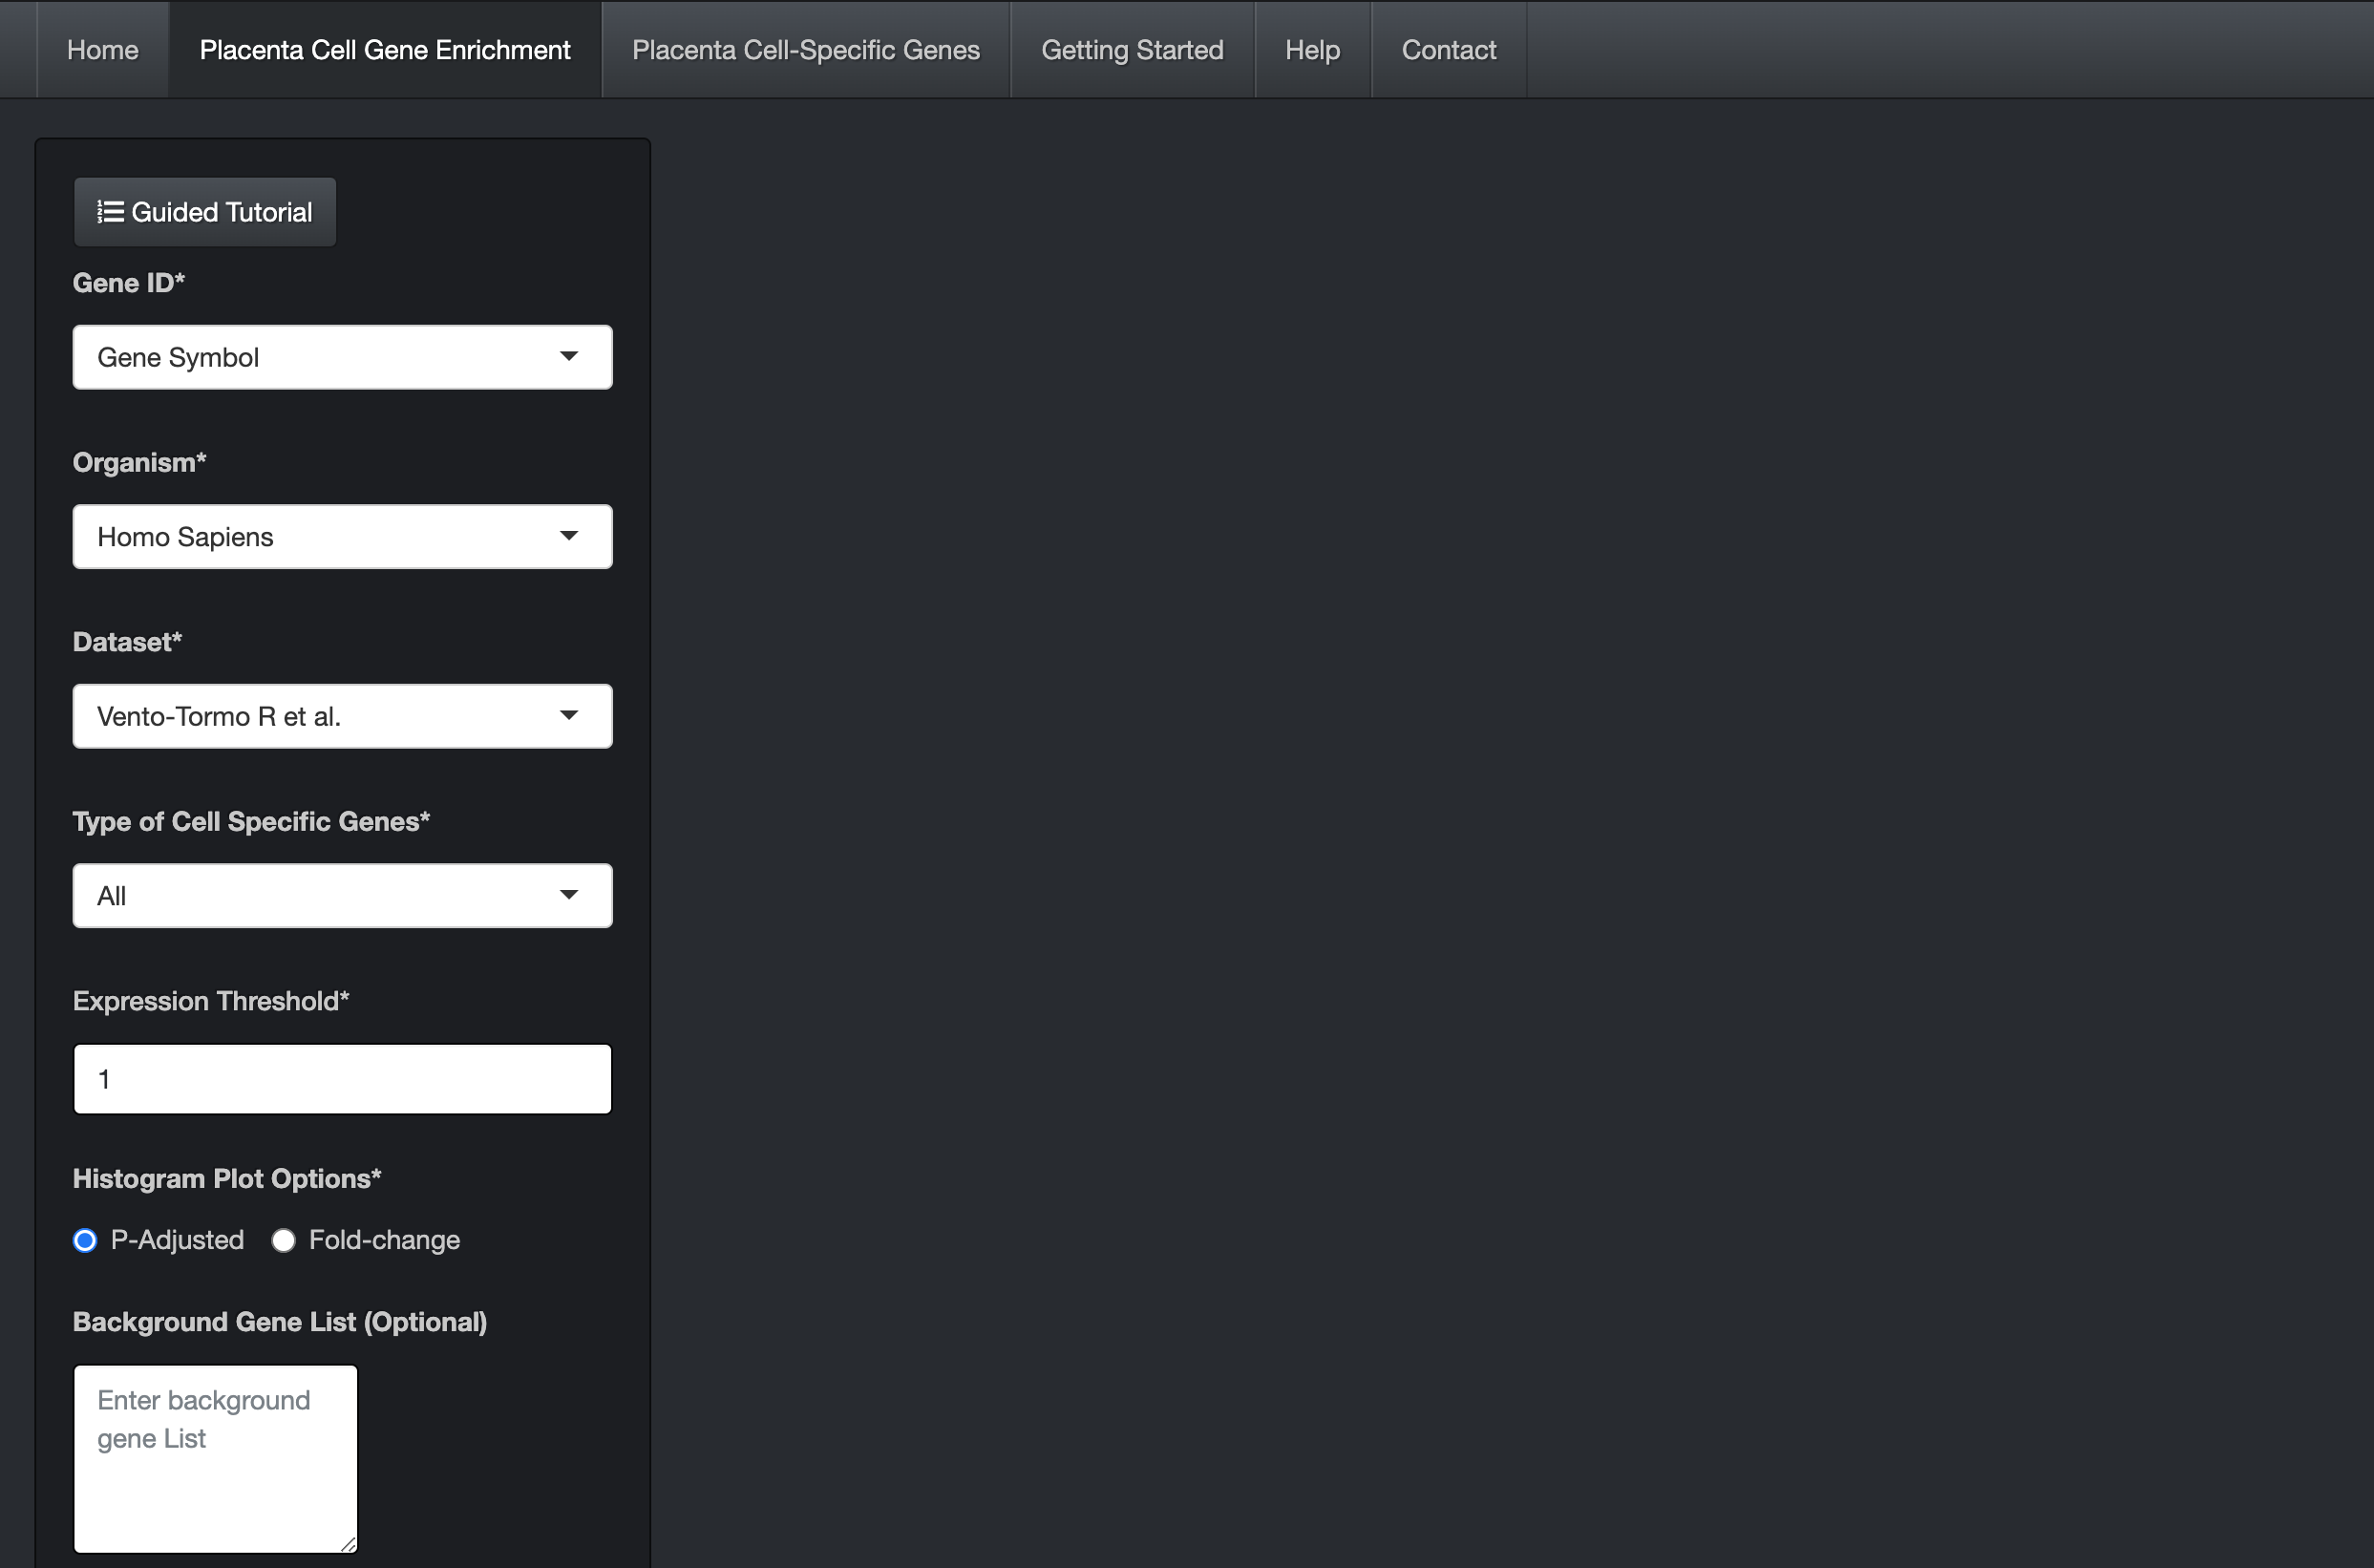
Vento-Tormo R et al.:
scRNA-Seq data across 32 placental and decidual cells
-
Arutyunyan A et al.:
scRNA-Seq data across 42 placental and decidual cells
Background Genes
PlacentaCellEnrich enables users to provide background genes for carrying out cell-specific gene enrichment. In this case, instead of using all the genes in the dataset, a background gene set is being used to carry out the enrichment analysis. It should be noted that the background gene set must have all the genes of the input gene set. The p-value is calculated as:
$$P(X \gt k) = \sum\limits_{i=k+1}^n \frac{{{K_b}\choose{i}} {{N_b-K_b}\choose{n-i}}}{{{N_b}\choose{n}}}$$
Where, \(N_{b}\) is the total number of background genes, \(K_{b}\) is the total number of cell-specific genes for a cell in background genes, n is the number of genes in the input gene set, k is the number of cell-specific genes in the input gene set. The p-values are corrected for multiple hypothesis testing using the Benjamini & Hochberg correction. If the background gene set is not provided all the genes will be used as background.
Why are a lot of genes in the input data not found?
The user should first ensure that they selected the appropriate Gene ID, and organism, and entered the genes one per line. It is also important to note that we are only analyzing protein-coding genes, due to which non-coding genes are not found in the datasets. Additionally, when genes from a non-human species are being used as input, if an orthologous gene is not identified, it will not be found in the datasets.
Why is No.of.Cells always "N.A." for Suryawanshi et al. data?
Suryawanshi et al. study doesn't provide the number of cells of the identified placenta and decidua cell clusters. Due to this, we are showing "N.A." for the number of cells for Suryawanshi et al. data.
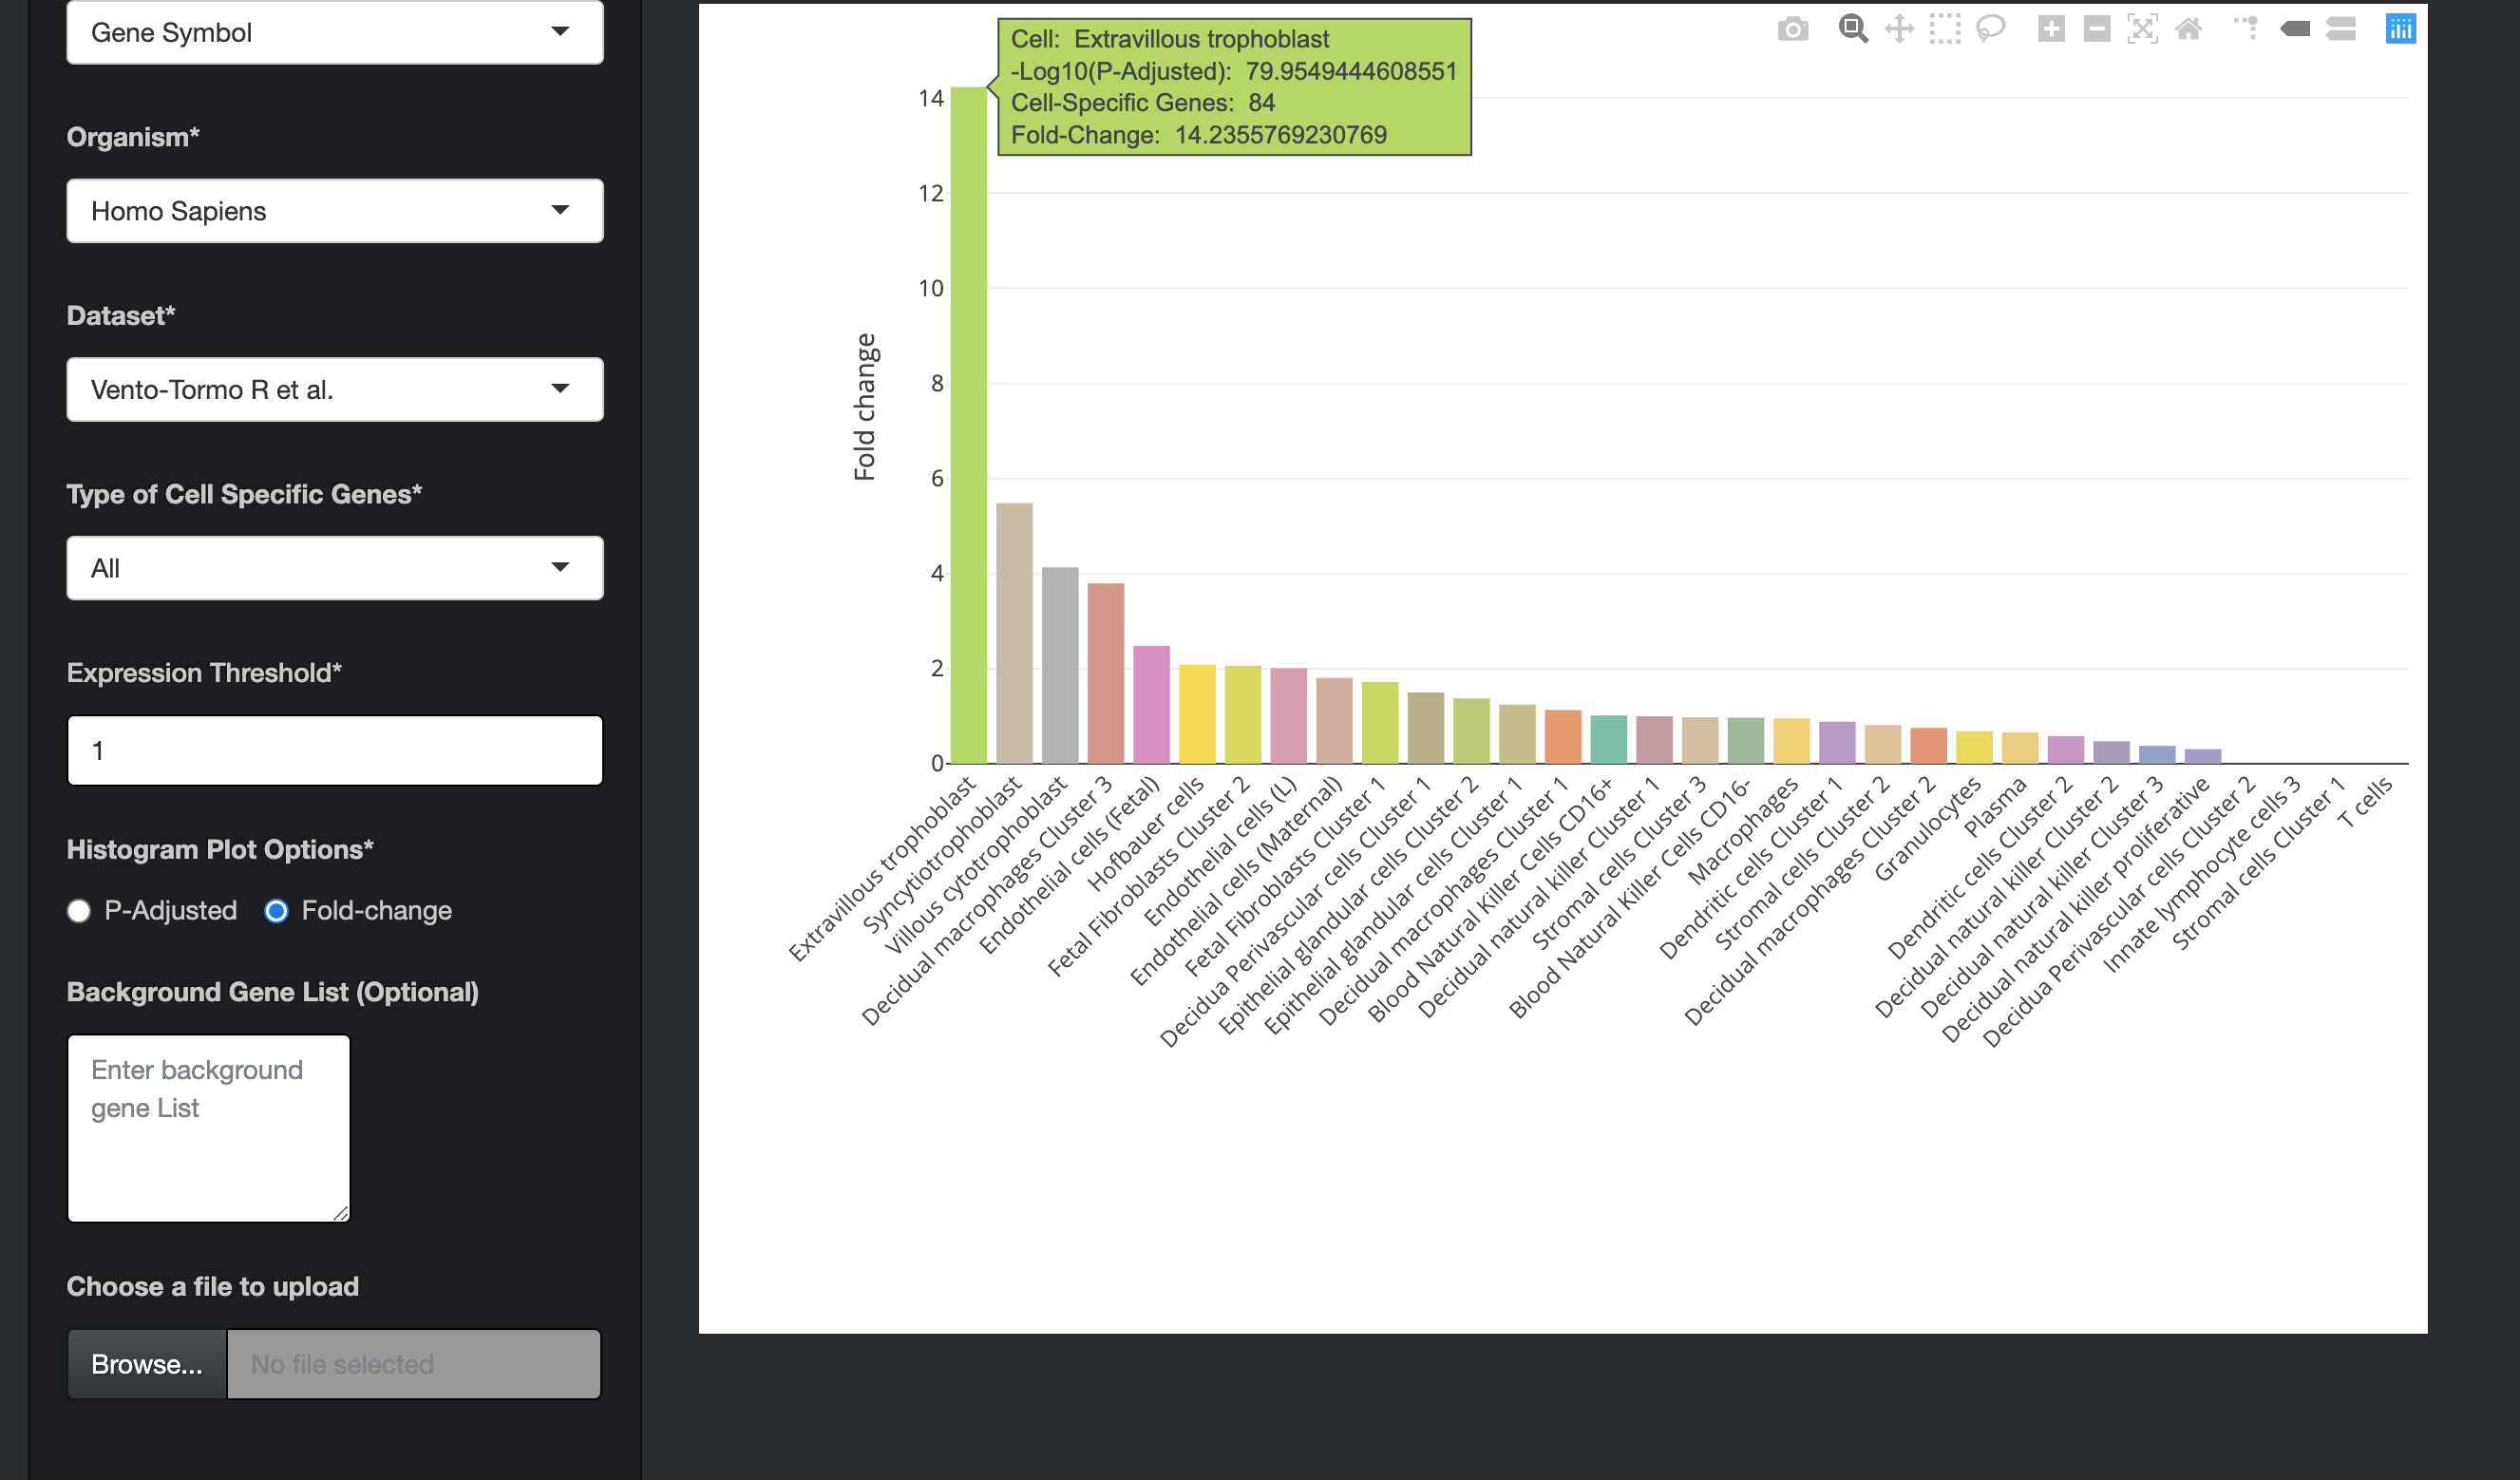
Columns in the CellSpecificGeneEnrichment.tsv file
-
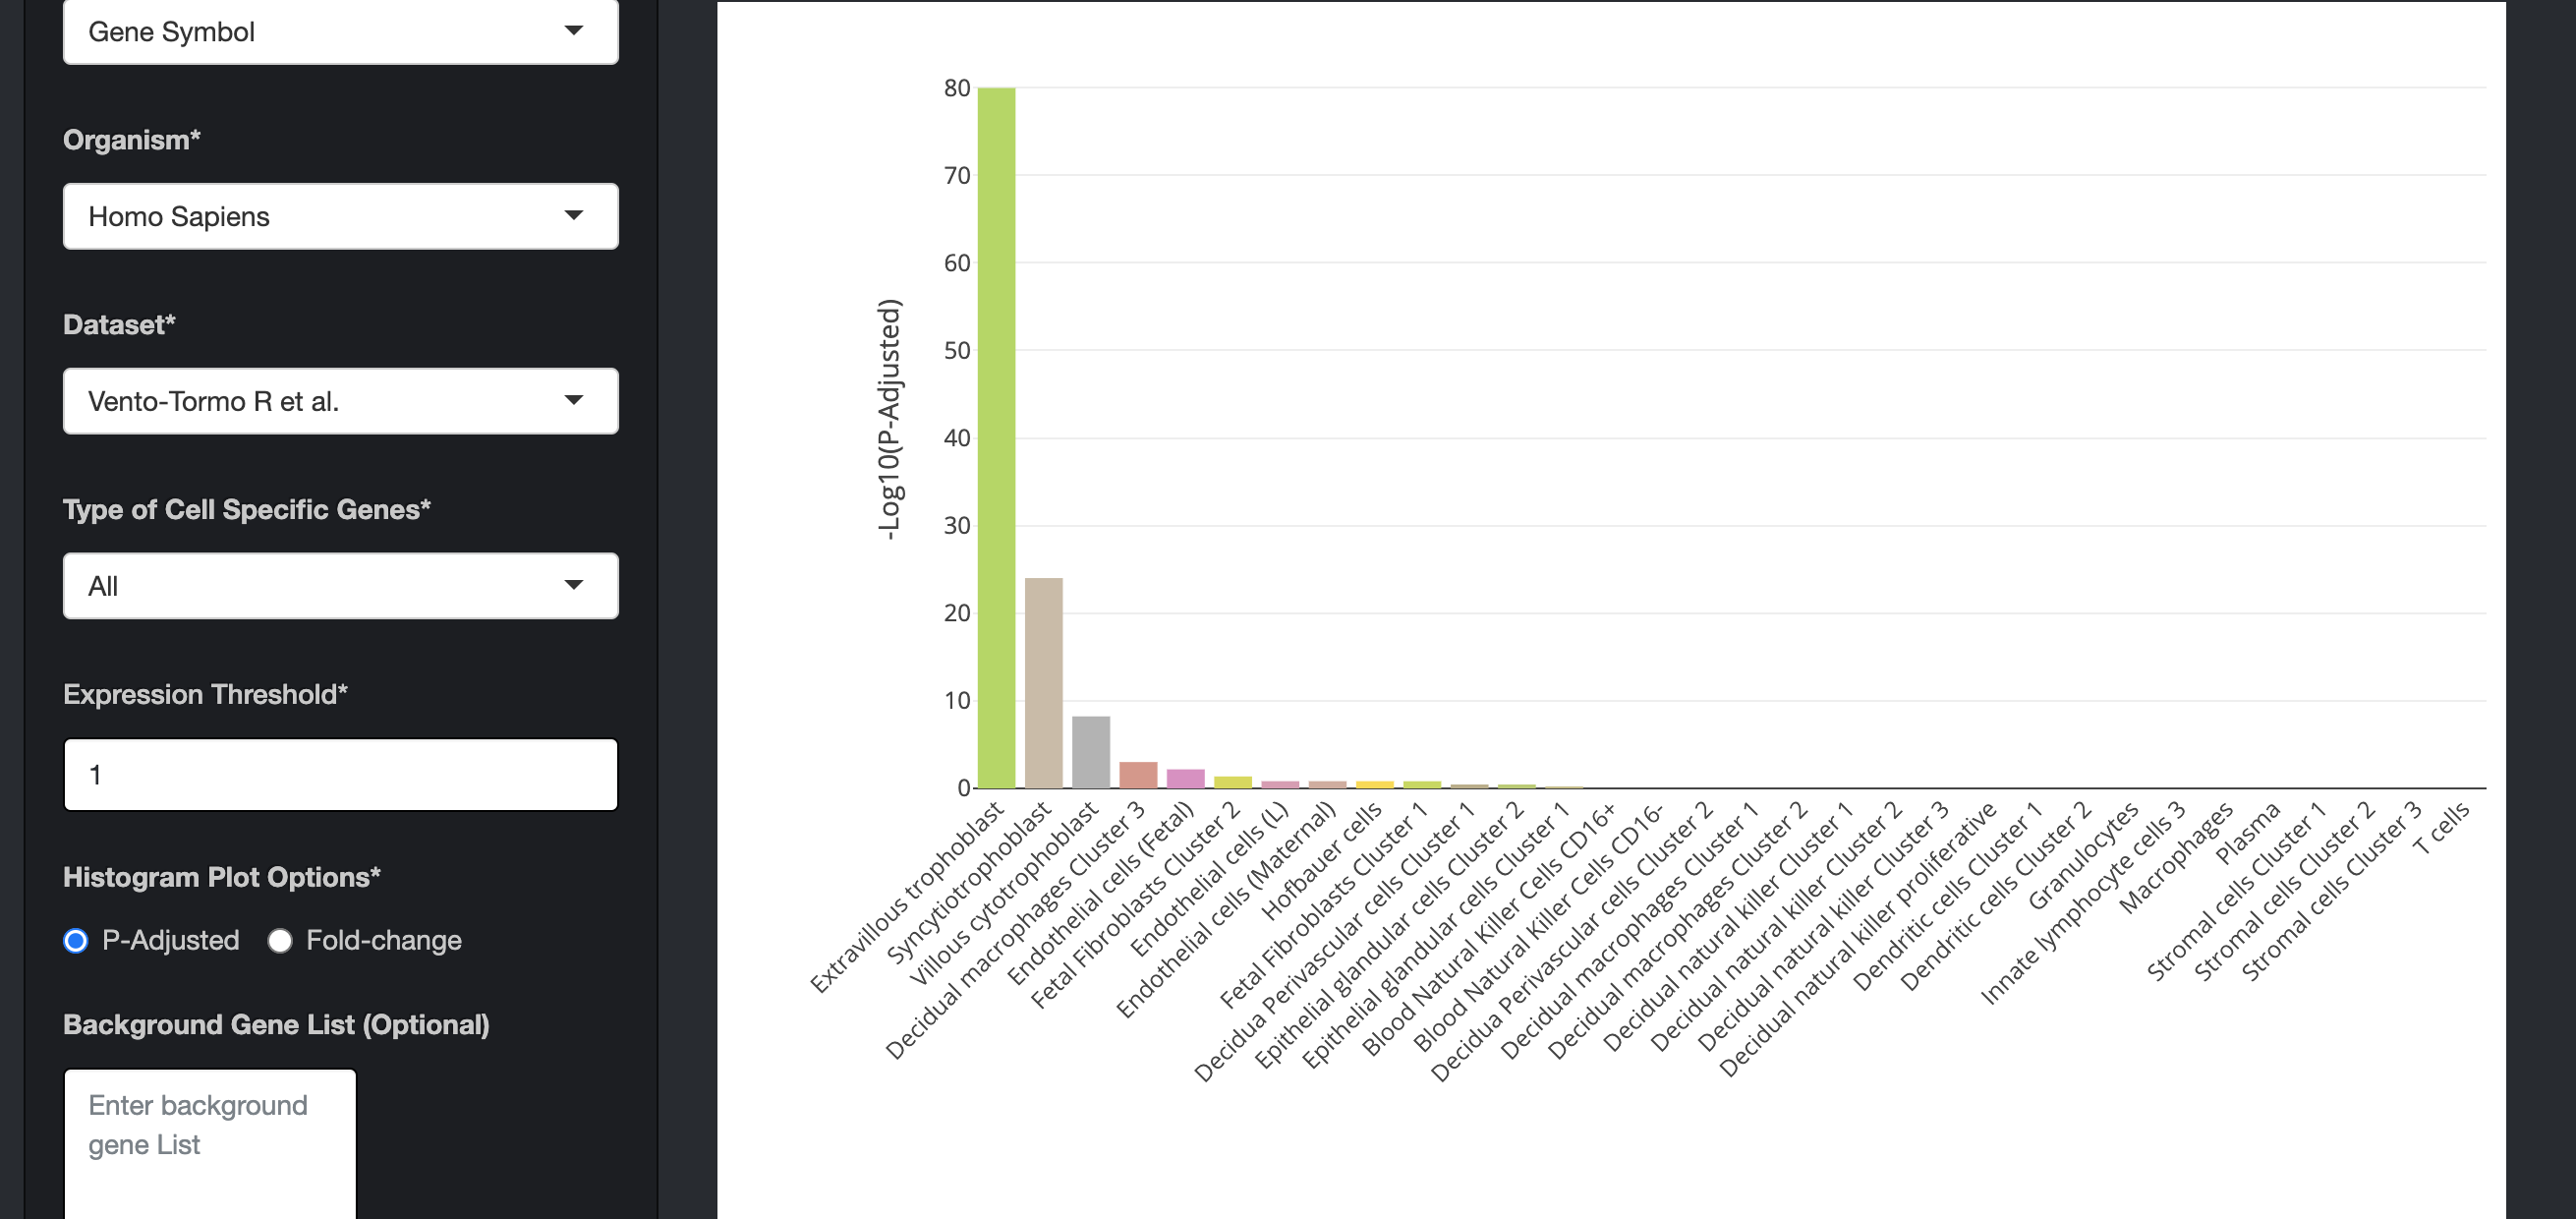
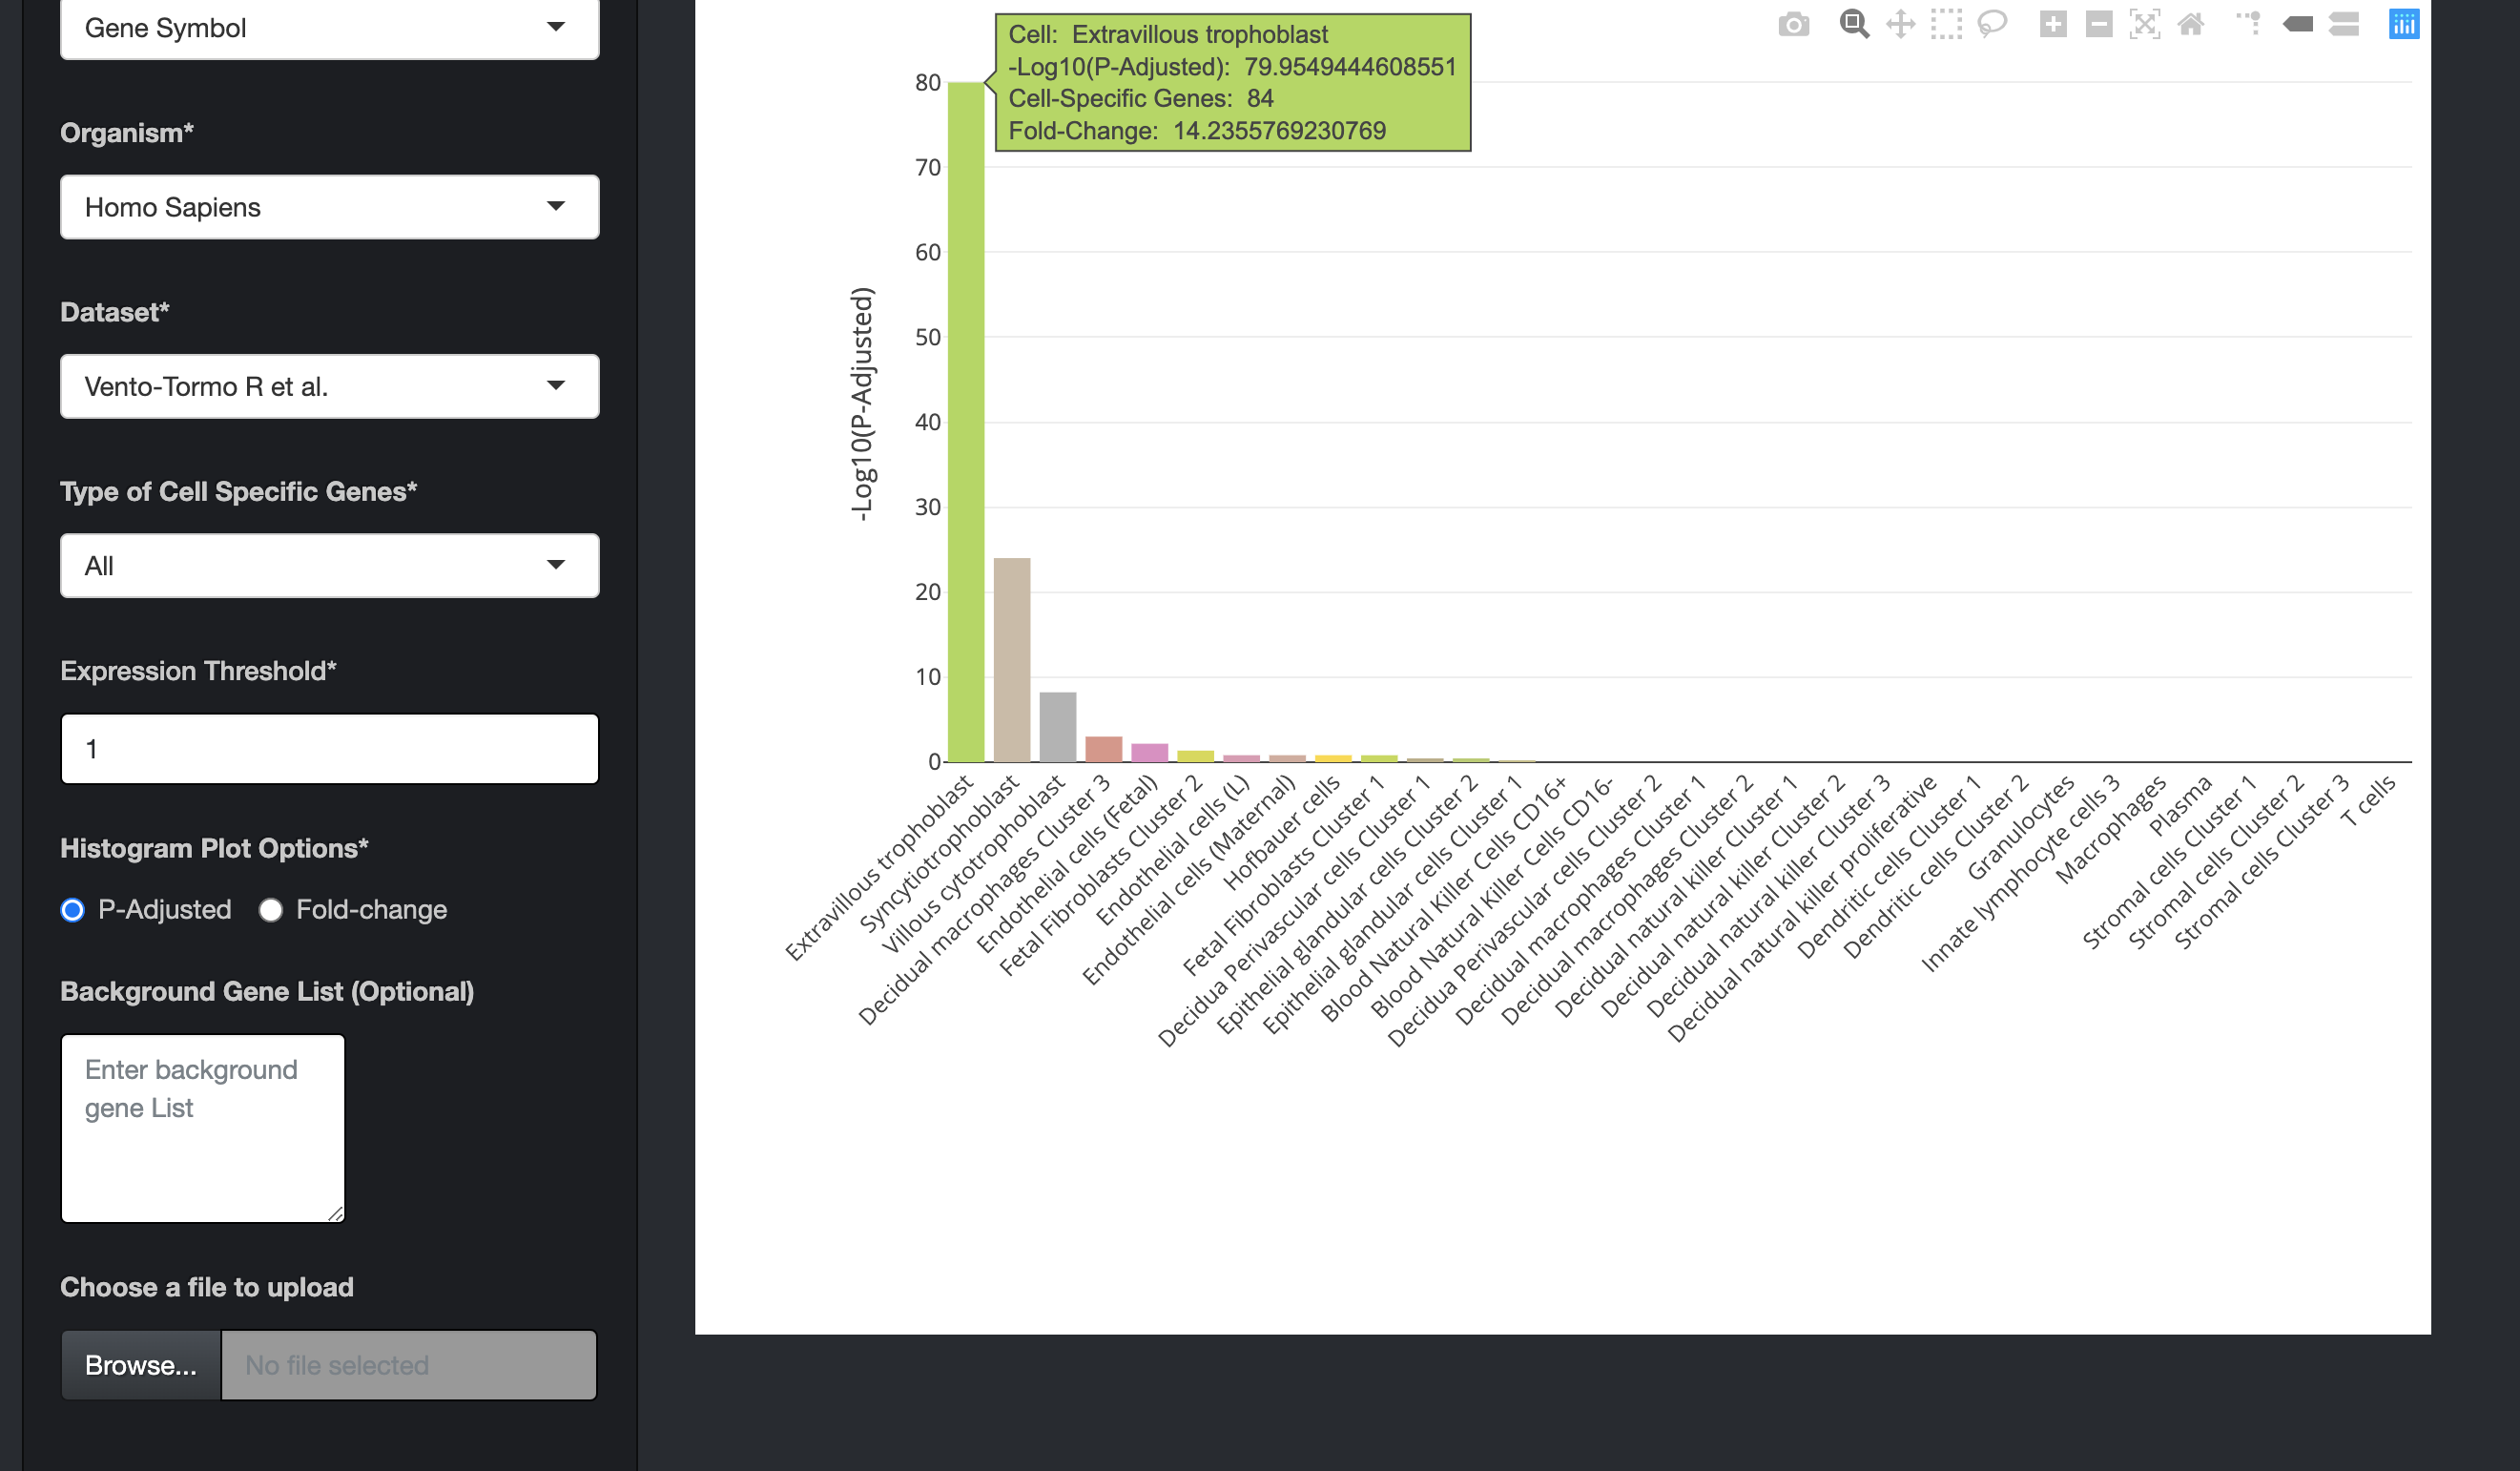
Cell:
Cell type.
-
-Log10PValue:
-log10 transformed adjusted P-Value.
-
#Cells:
Total number of cells representing the cell type in the dataset.
-
Cell-Specific Genes:
Total number of cell-specific genes enriched in the input gene set.
-
Fold-change:
Fold-change of the cell-specific genes in the input gene set.
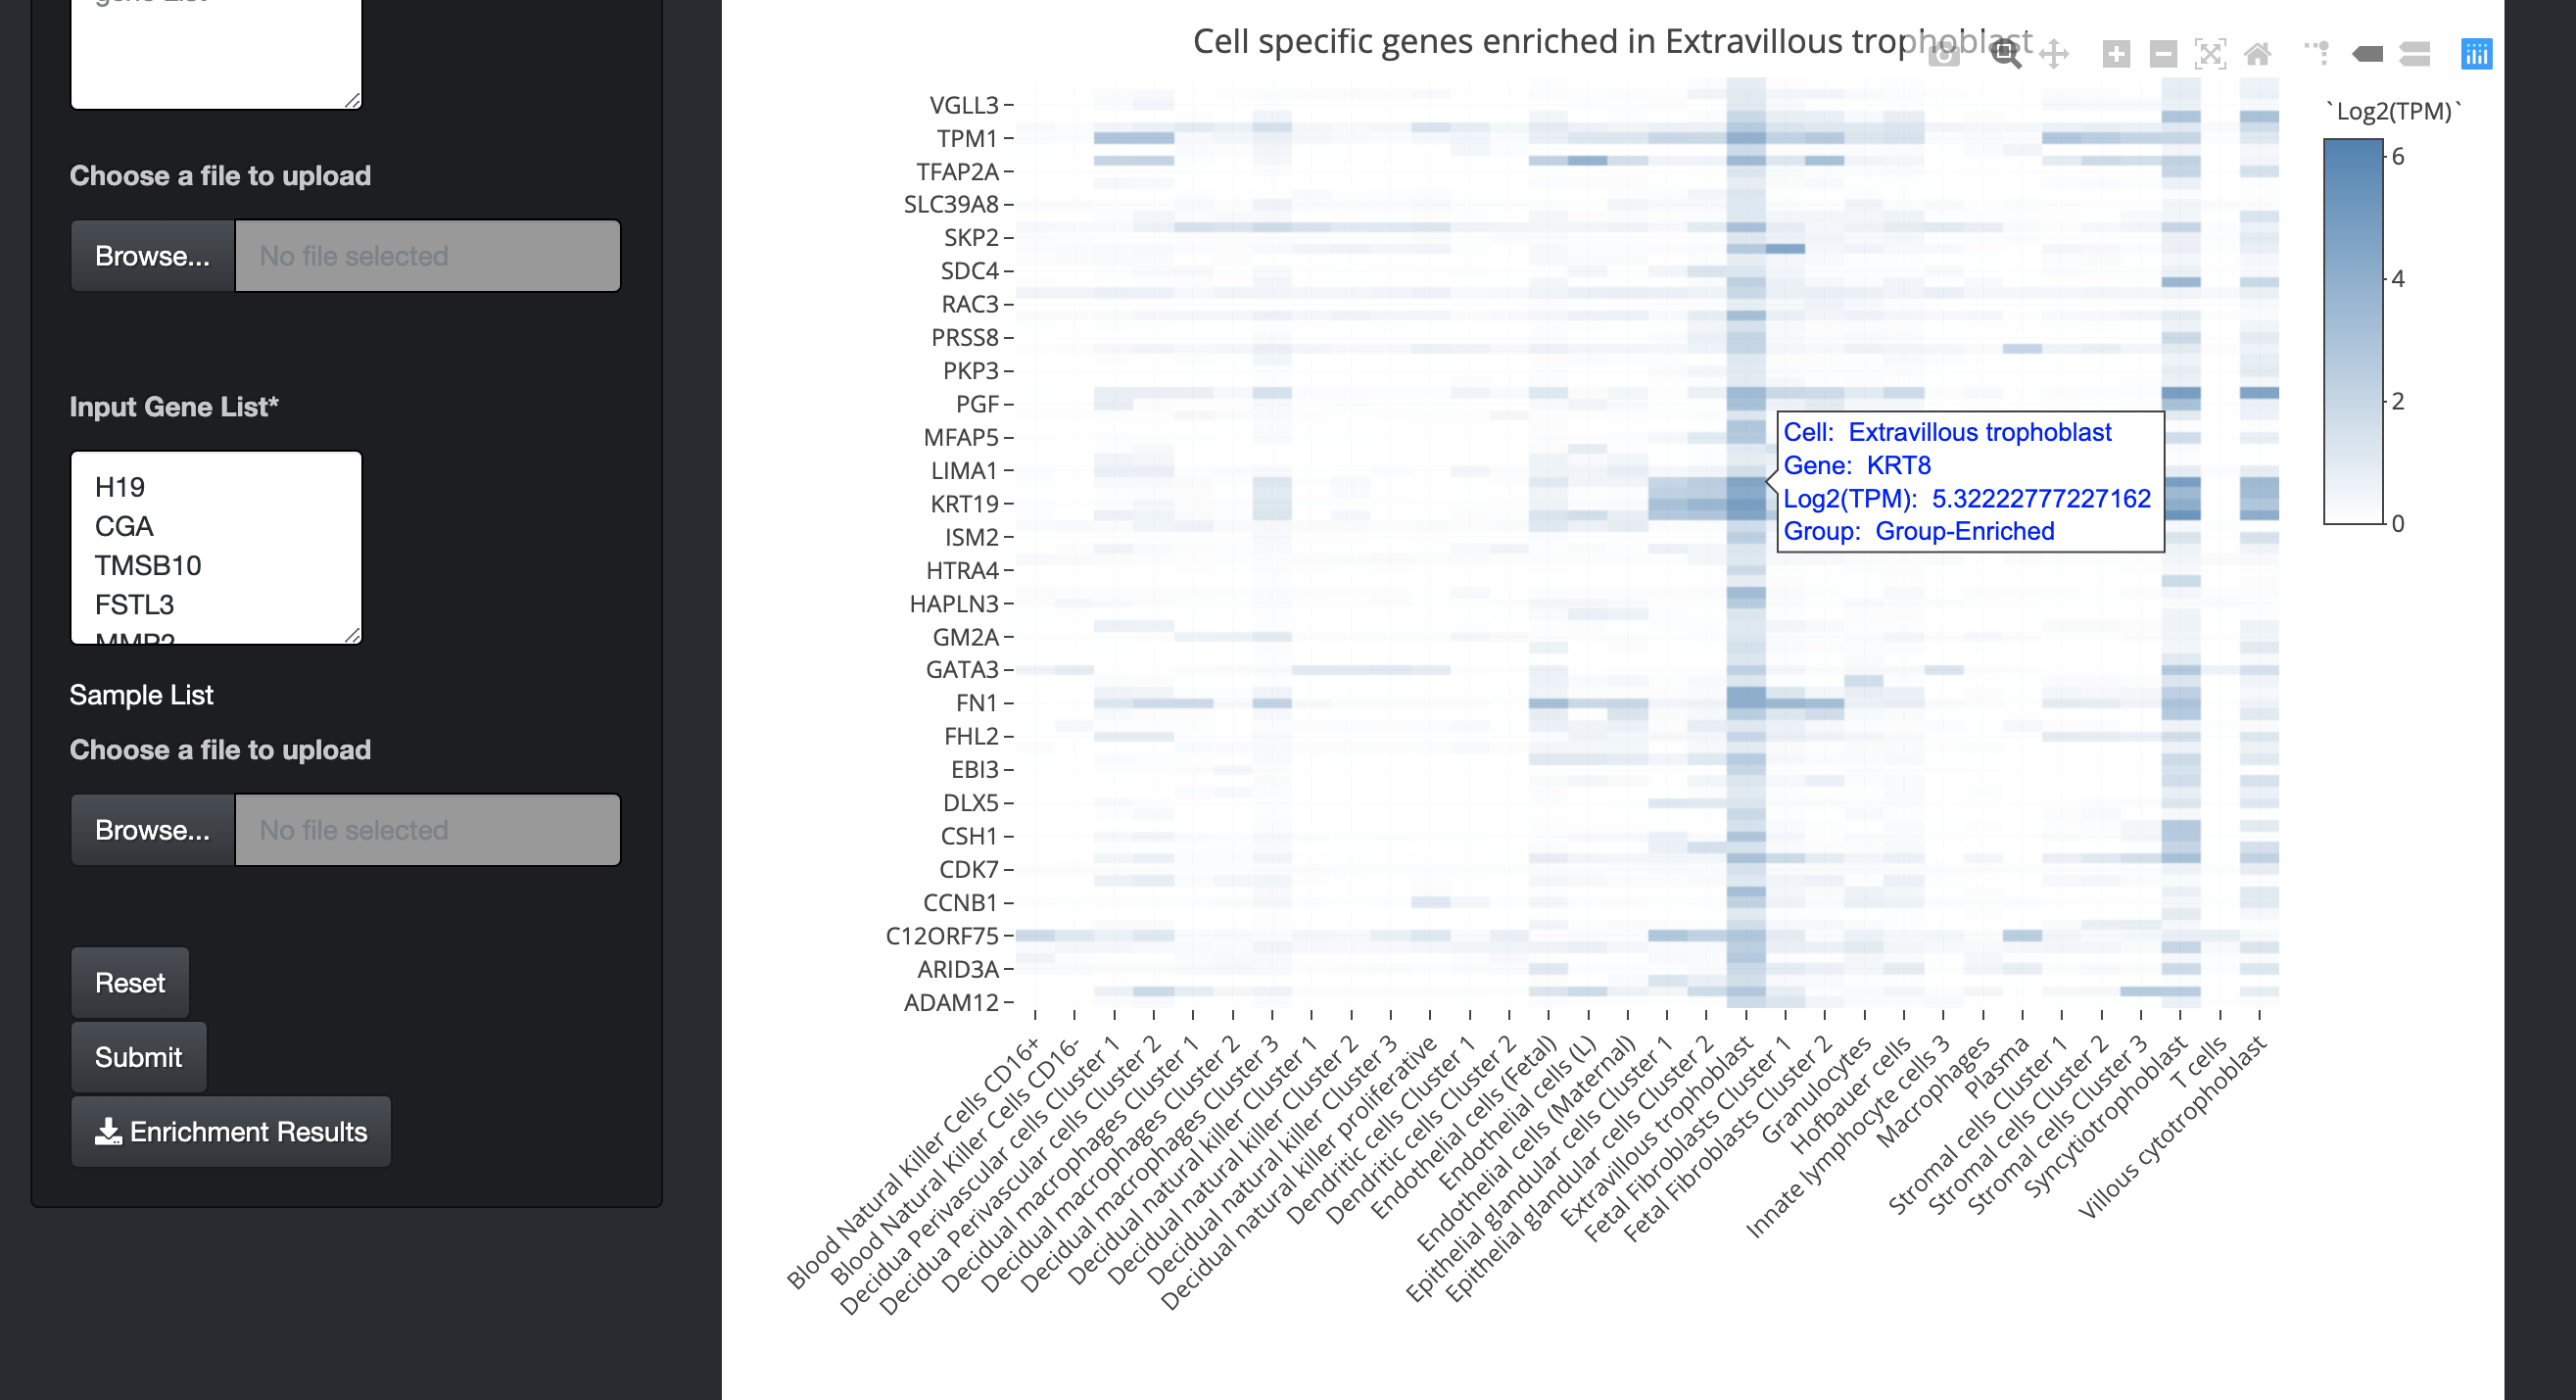
CellSpecificGeneExpression.tsv file
-
Gene:
Cell-specific gene name.
-
Cell:
Cell type.
-
Log2(TPM):
Log2 transformed TPM like expression value.
-
Group:
Cell-specific gene group.
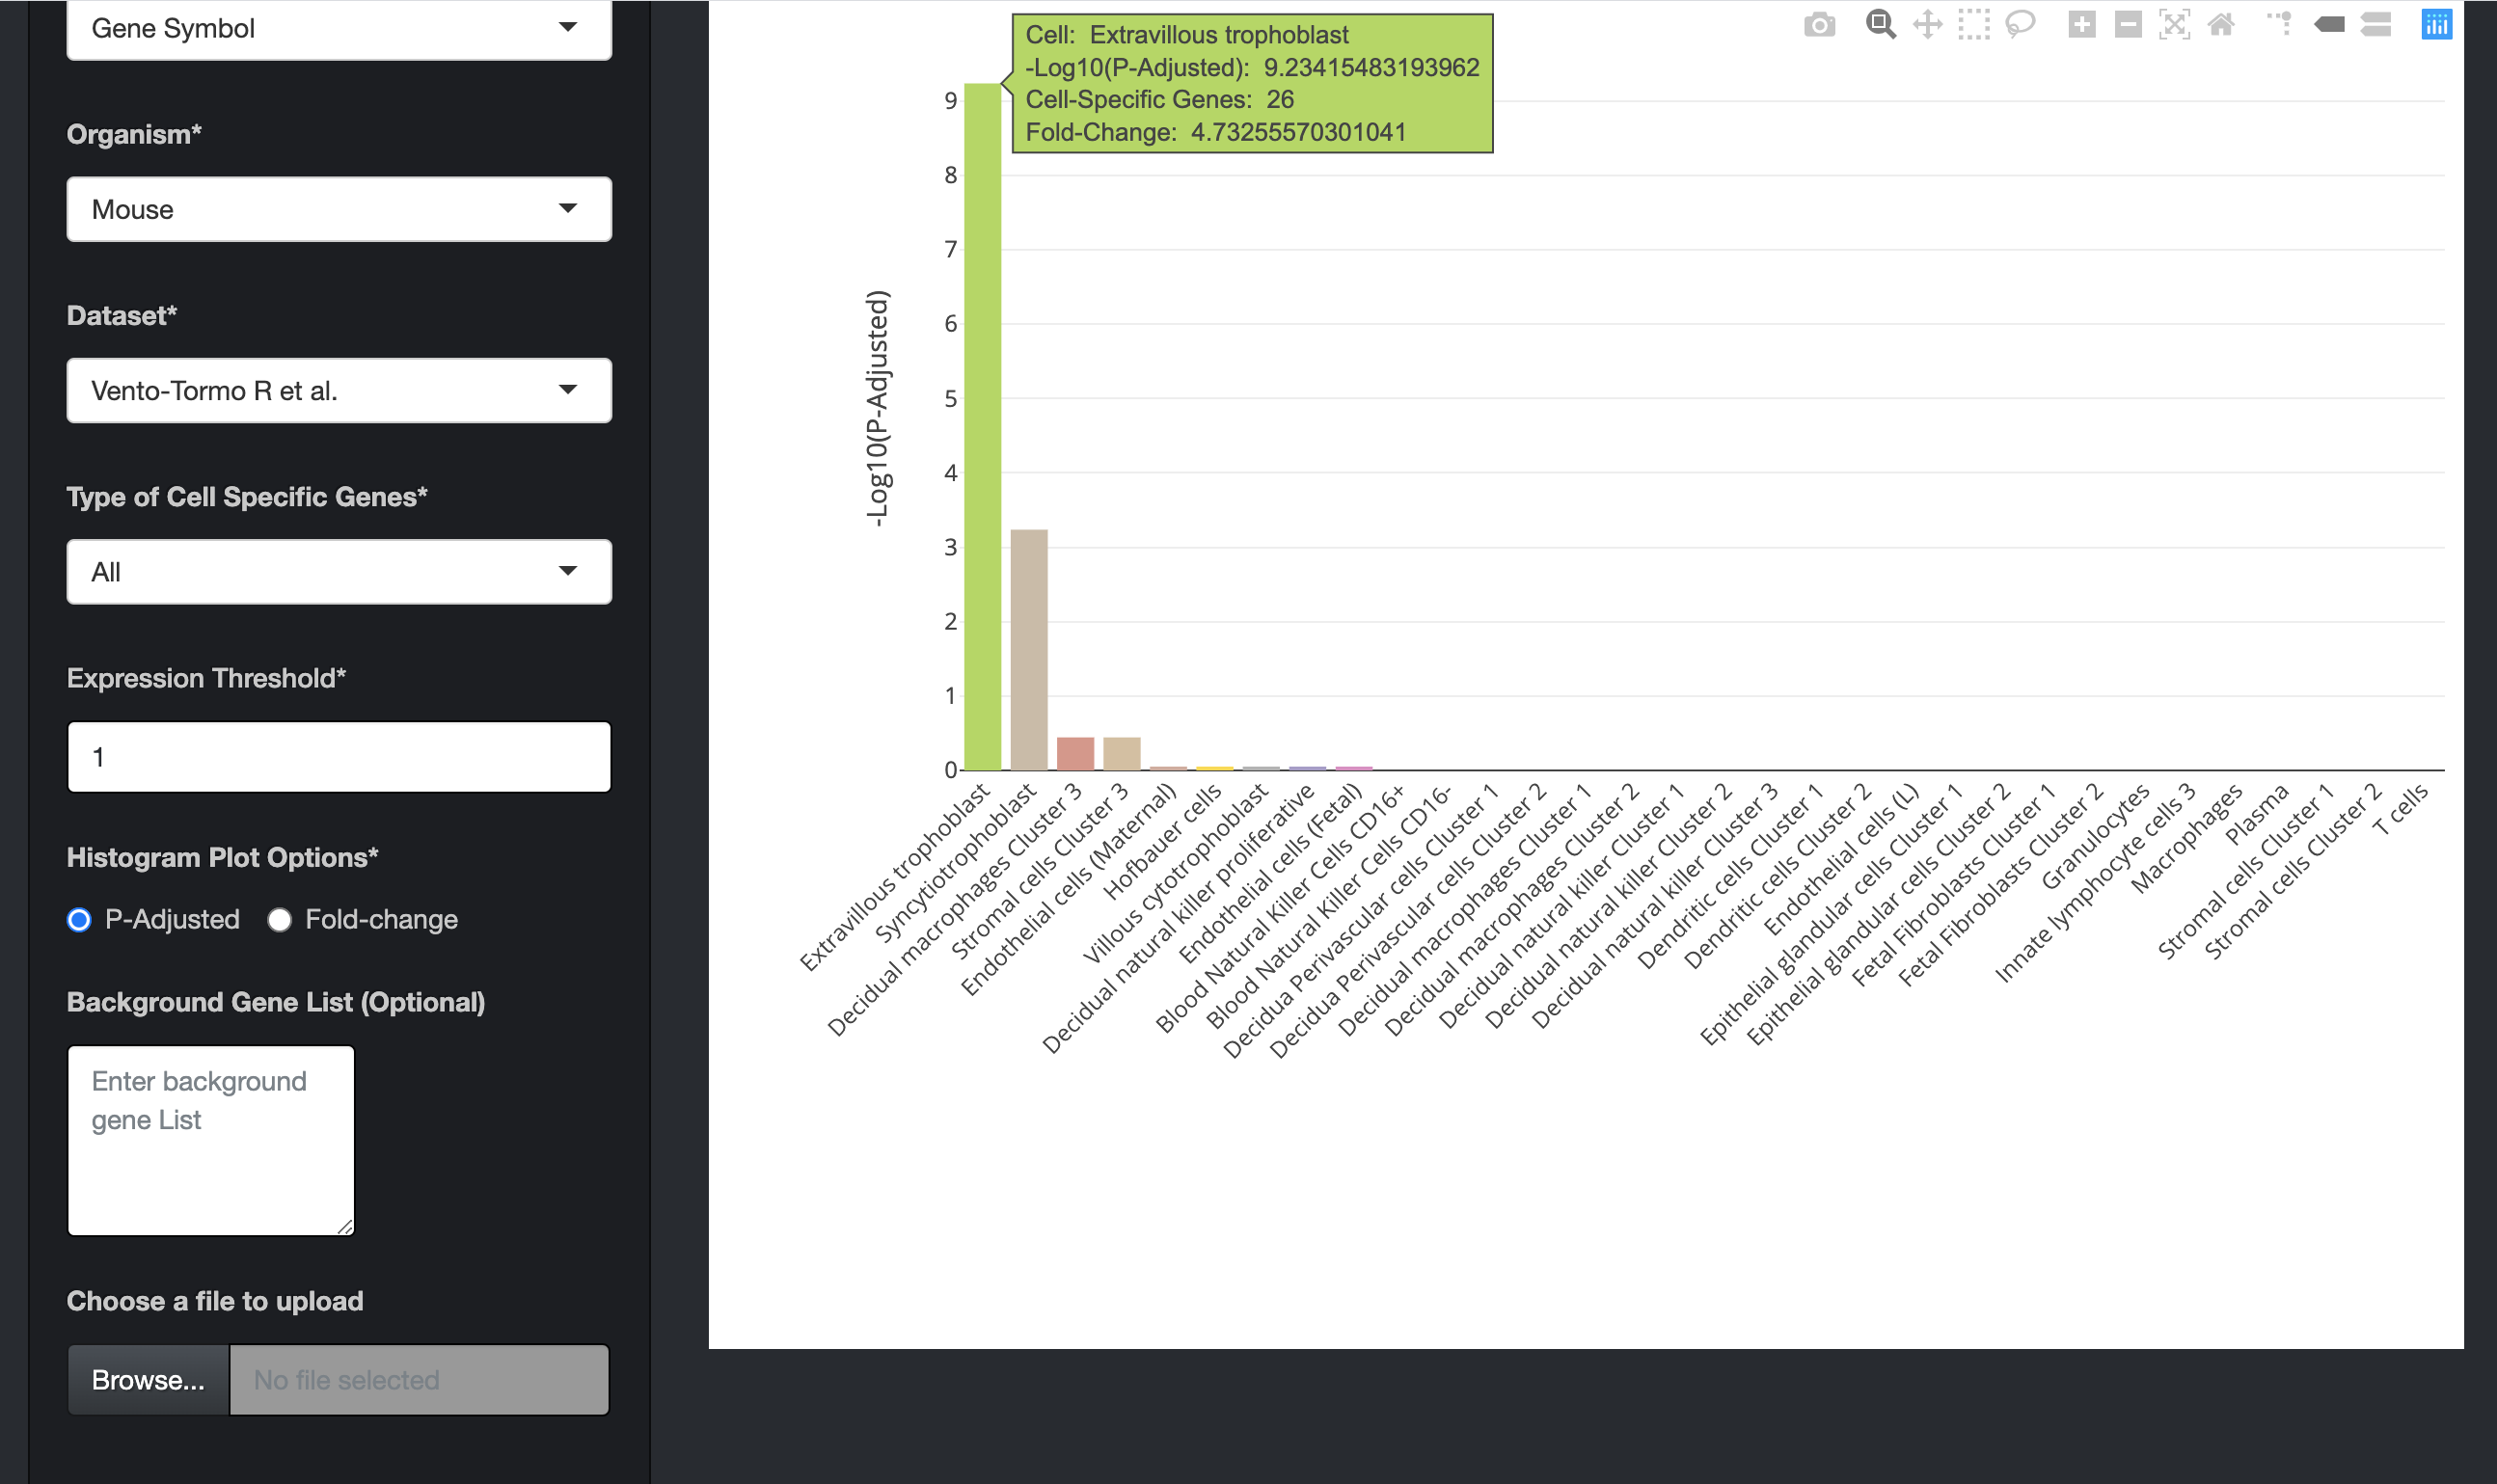
How should I interpret my results?
-
The recommended threshold value of the adjusted p-values and fold-change for selecting the enriched cells is 0.01 and 2 respectively.
-
It is also recommended that the users should look at cell-specific gene enrichment from all the sources and have the highest confidence in results that are consistent across datasets.
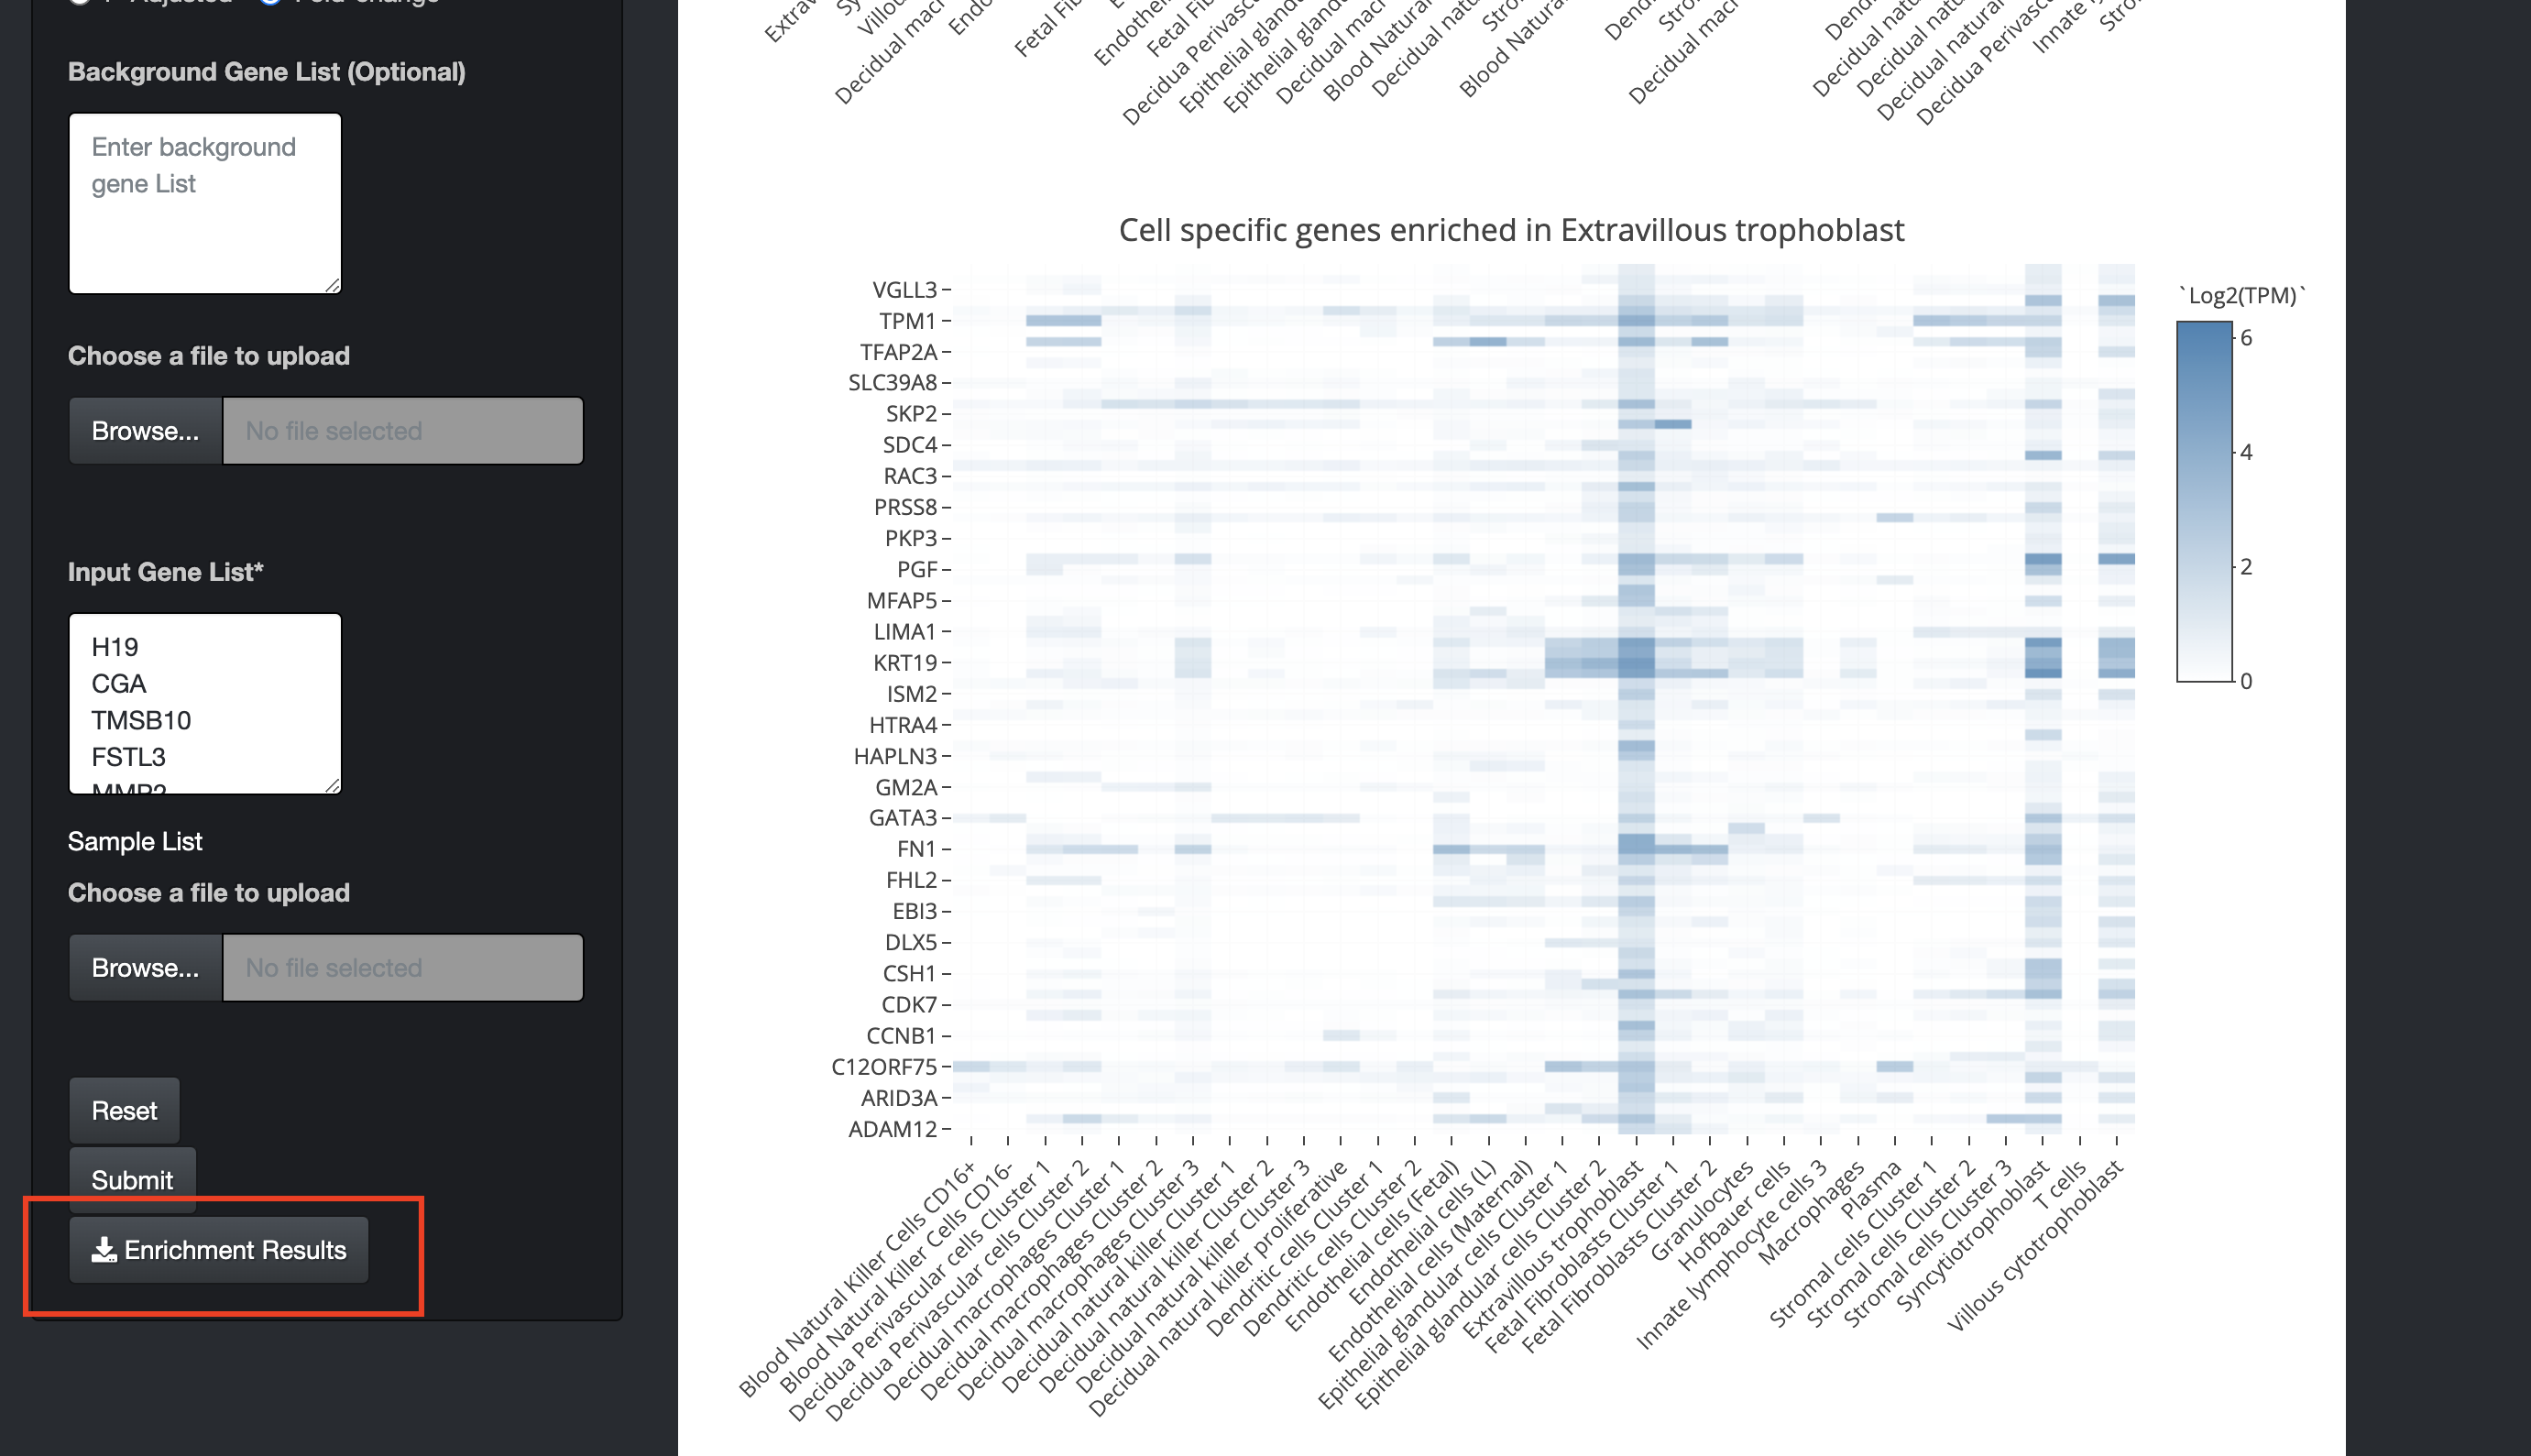
How come the enrichment plot does not show any results?
If a bar plot is shown with no bars, that indicates that there is no enrichment for any groups of cell-type specific genes. You can try adjusting your gene set size, or parameters in PlacentaCellEnrich (type of cell specific expression or try including a background list). If you still do not see any enrichment but are interested in groups that your genes belong to, you can use the Fold-change plot option instead of the P-Adjusted plot option, keeping in mind that results are not significant. You can also download details of which group your genes belong to by clicking the "Enrichment Results" button.
Contact Details
Tuteja Lab (
geetu@iastate.edu
)
2106 Molecular Biology Building
2437 Pammel Drive
Department of Genetics, Development and Cell Biology
Iowa State University
Ames, IA 50011